Tutorial 0: R Basic functions
Andreas Niekler, Gregor Wiedemann
2020-10-08
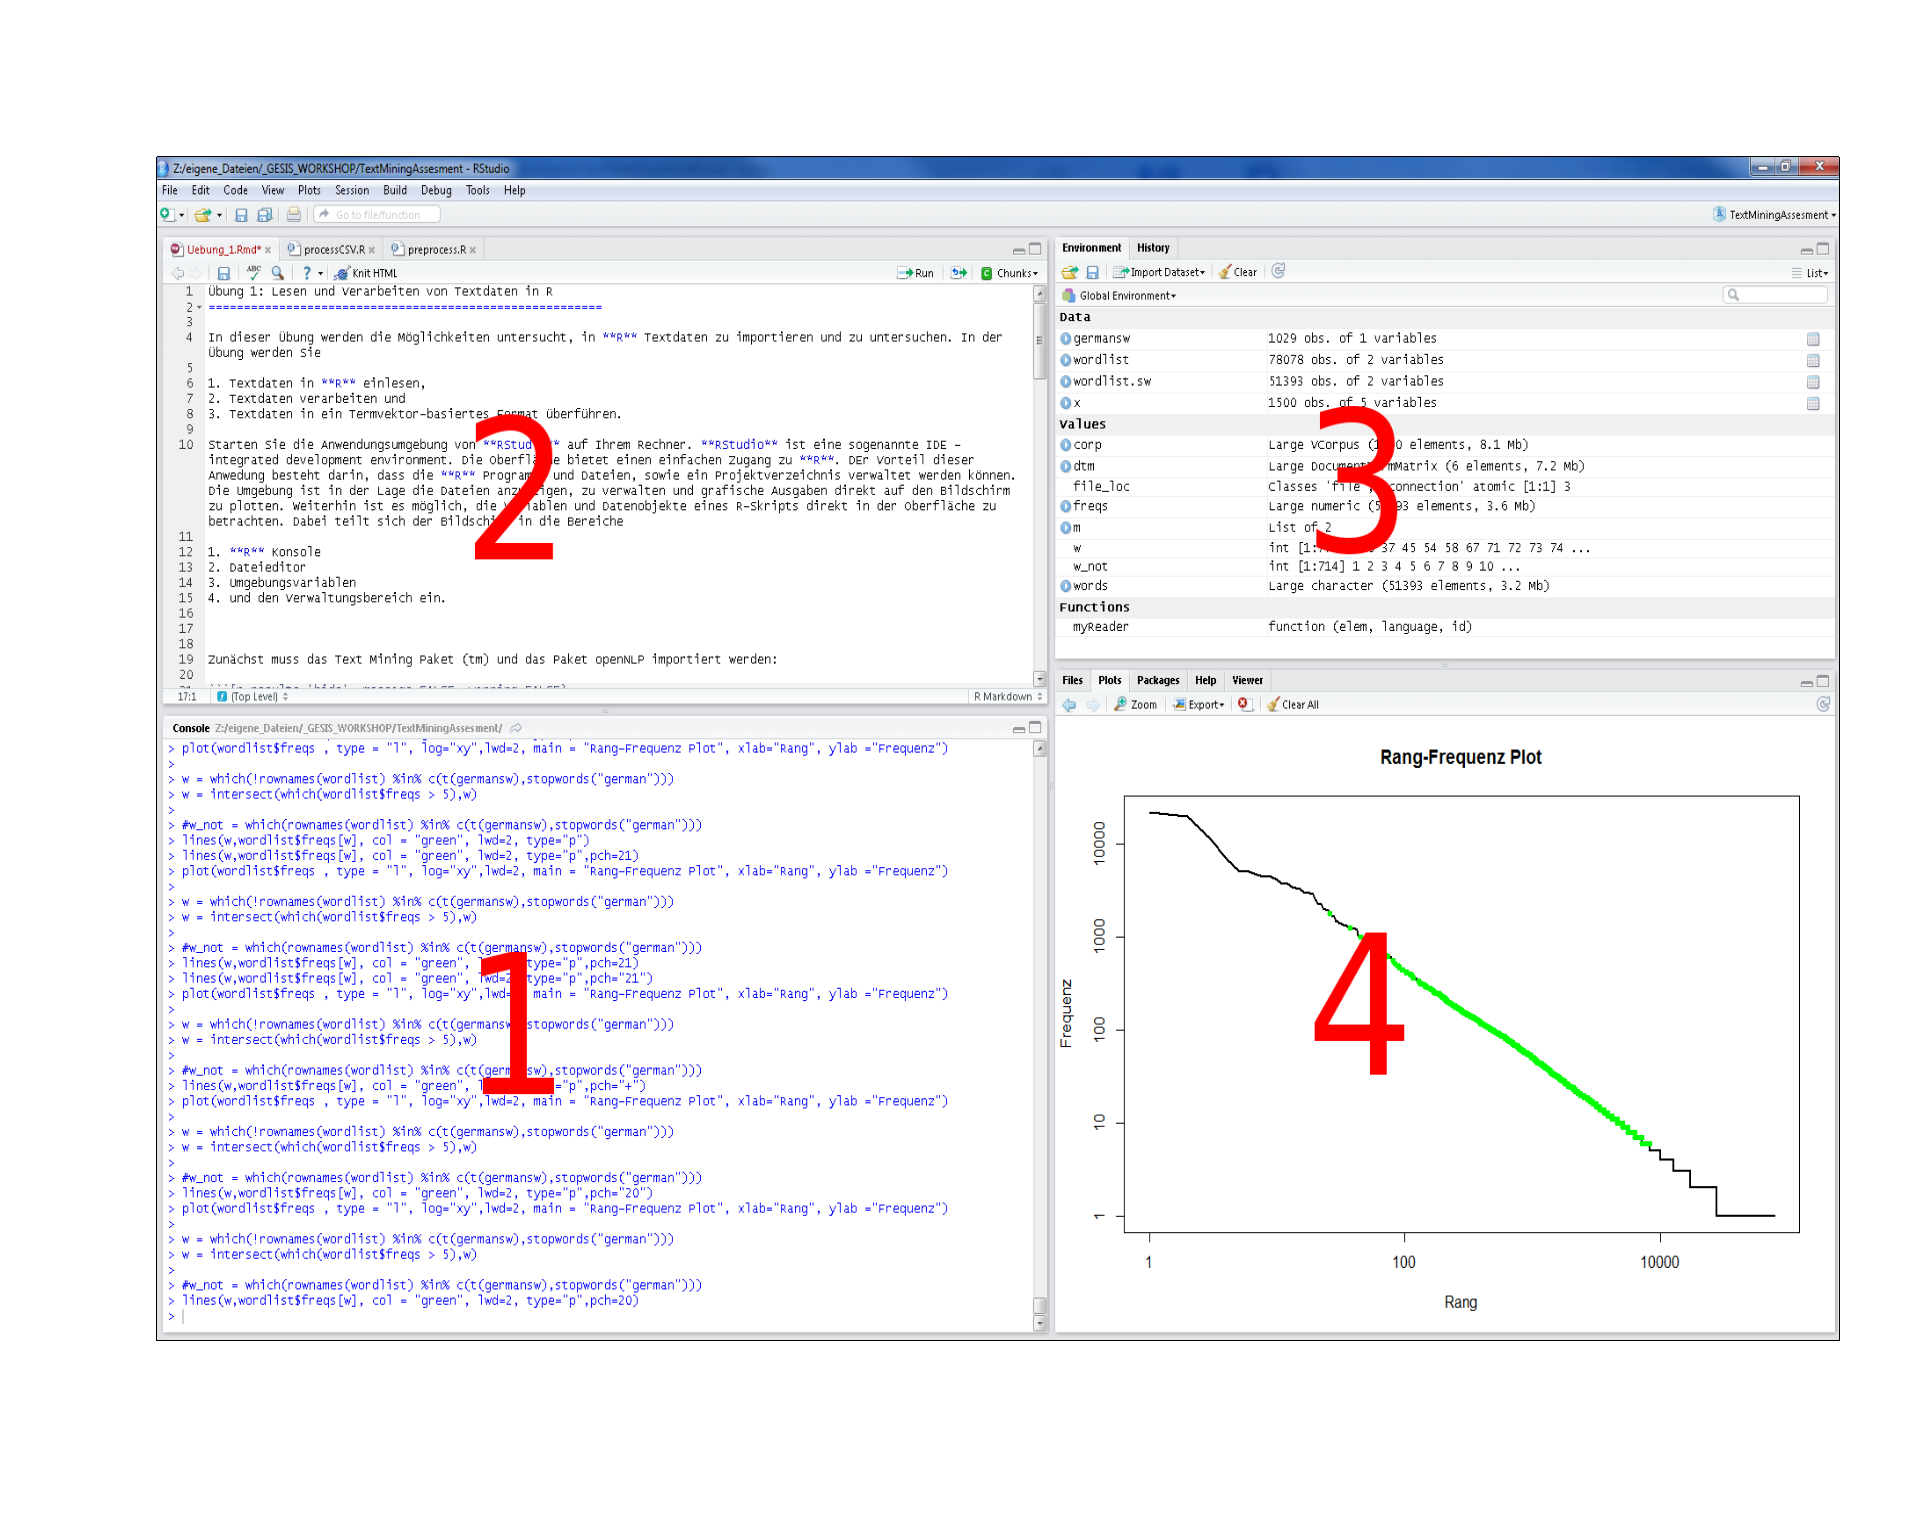
Start RStudio on your computer. RStudio is a so-called IDE - Integrated Development Environment. The interface provides easy access to R. The advantage of this application is that R programs and files as well as a project directory can be managed easily. The environment is capable of editing and running program code, viewing outputs and rendering graphics. Furthermore, it is possible to view variables and data objects of an R-script directly in the interface. The screen divides into the areas
- R console
- File editor
- Environment variables
- Management panes (File browser, plots, help display and R packages).
1 Basic Operations
1 + 2      # addition
sqrt(9)    # square root function
x <- 1     # assignment
1:10       # sequence

# install.packages("quanteda")
library("quanteda")
require("quanteda")

# help
help(require)
?require
apropos("nova")

# set your working directory
setwd("~")
2 Data types
x <- 10.5
typeof(x)
class(x)
as.integer(x)
is.integer(x)
is.integer(as.integer(x))
x <- "3.14"
typeof(x)
x <- as.double(x)
1:3 == c(1, 2, 3)

# functions
my_x_square_function <- function(x) {
  result <- x ^ 2
  return(result)
}
plot(my_x_square_function(seq(-5,5)), type="l")
3 Vector, matrix and data.frames
options(stringsAsFactors = F)

myvector <- c(1, 2, 3)
names(myvector) <- c("one", "two", "three")
print(myvector)
print(myvector[1:2])
print(myvector[-1])
sum(myvector)
mean(myvector)

mymatrix <- matrix(0, nrow=3, ncol=4)
rownames(mymatrix) <- c("one", "two", "three")
colnames(mymatrix) <- c("house", "sun", "tree", ".")
mymatrix[, 1] <- 12
mymatrix[, "sun"] <- 4
mymatrix[3, 4] <- 5
mymatrix[2, 3:4] <- 9
colSums(mymatrix)
rowSums(mymatrix)
colMeans(mymatrix)

mydatdaframe <- data.frame(v = c(1, 2, 3), c = as.character(myvector), n = c("one", "two", "three"))
mydatdaframe$v
mydatdaframe$c
mydatdaframe[, "c"]
mydatdaframe[1, ]
rowSums(mydatdaframe)
4 More basic functions
sort(mydatdaframe$n)
sort(mydatdaframe$n, decreasing = T)
c(myvector, myvector)
is.vector(myvector)
is.matrix(mymatrix)
is.matrix(myvector)

mymatrix / 2
mymatrix / myvector
t(mymatrix)
mymatrix %*% t(mymatrix)


cbind(mymatrix, myvector)
rbind(mymatrix, myvector)

# example datasets: data.frame of arrests per USA states
data(USArrests)
View(USArrests)
dim(USArrests)
nrow(USArrests)
ncol(USArrests)
length(USArrests)
max(USArrests)

which.max(USArrests[, "Murder"])

o <- order(USArrests[, "Murder"], decreasing = T)
USArrests[o, ]

murderRates <- USArrests[o[1:5], "Murder"]
names(murderRates) <- rownames(USArrests)[o[1:5]]
barplot(murderRates)
2020, Andreas Niekler and Gregor Wiedemann. GPLv3. tm4ss.github.io